White Paper on International Graduate Retention Return
Migration and Transition to Permanent Status
International Graduate Retention, Return Migration and Permanent-Status Transition
Does the economic development of the country of origin
determine whether students are reluctant to return? | October 2026 | World
Schools League / WSL AI
Executive Summary
This white paper examines three distinct outcomes after
international students complete their education abroad: (1) remaining in the
study destination country; (2) leaving the destination country, either to
return to the country of origin or to move to a third country; and (3)
progressing from temporary student or work status to permanent residence or
citizenship. These are three different statistical questions. Many publicly
available reports can observe only whether individuals remain in the destination
country. Accordingly, departure from the destination country cannot be equated
with return to the country of origin. This report uses the terms “return to
origin” and “overseas” only where the data actually track location.
The findings support a qualified conclusion: the poorer the
country of origin, or the greater the gap in economic opportunities between
origin and destination, the greater the tendency for international students to
remain in the destination country over the long term, particularly to acquire
permanent status. However, this relationship is not a mechanical rule.
Historical cohort data from Statistics Canada covering 18 Asian places of
origin show a Pearson correlation of ?0.62 between log GDP per capita in the
place of origin and acquisition of Canadian permanent residence within ten
years, with Spearman’s ? = ?0.54 and a quadratic-fit R² of 0.38. This indicates
substantial explanatory power for income differences, although field of study,
age, family circumstances, immigration policy, language, destination-country
wages, and political and social conditions in the country of origin can still
affect outcomes.
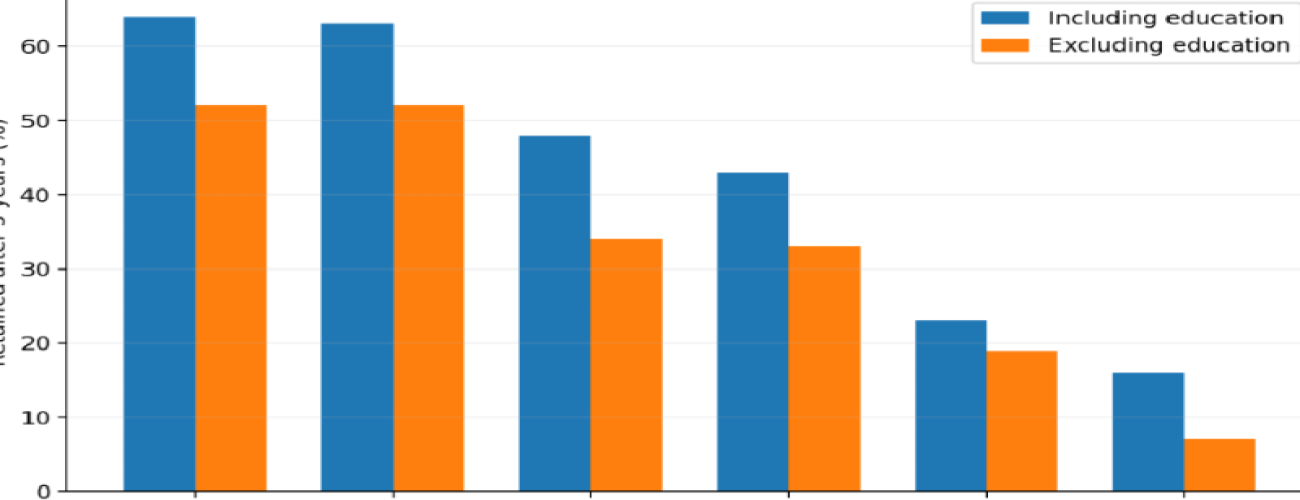
Differences between destination countries are also substantial. The OECD followed individuals first granted study permits in 2015 through to 2020. Approximately 64% in Canada, 63% in Germany, 48% in Australia, 43% in France, 23% in the Netherlands, and 16% in the United Kingdom still held valid status. Excluding those still holding education-related status, the corresponding proportions were approximately 52%, 52%, 34%, 33%, 19%, and 7%. Post-graduation retention therefore reflects both students’ individual preferences and the institutional arrangements of destination countries.
1 Distinguishing Retention Employment Permanent Status
and Return Migration
|
Indicator |
Strict
meaning |
Must
not be equated with |
|
Stay /
retention |
Still
resident or holding valid status a specified number of years after graduation
or the first study permit |
Permanent
immigration |
|
Work-route
retention |
Transition
to a post-graduation work permit, skilled work visa, or similar route |
Permanent
residence / citizenship |
|
Permanent
status |
Permanent
residence, settlement / ILR, a permanent settlement permit, or citizenship |
An
ordinary work visa |
|
Exit /
non-retention |
No
longer recorded as holding valid residence status in the destination
country’s administrative data |
Return
to the country of origin |
|
Return
to origin |
Return
to the place of origin confirmed by data |
All
departures from the destination country |
2 Post Graduation Retention Rates in Developed
Destination Countries
Figure 1. OECD harmonised measure: five-year retention of
the 2015 first-study-permit cohort
|
Destination
country |
Valid
status after 5 years |
Excluding
those still studying |
Retention
after about 10 years |
Interpretation |
|
Canada |
64% |
52% |
About
44% |
High
retention; strong post-graduation work and economic immigration pathways |
|
Germany |
63% |
52% |
About
45–46% |
High
retention; a high share also holds permanent status after ten years |
|
Australia |
48% |
34% |
About
29% |
Moderately
high retention; many graduates initially move to other visas |
|
France |
43% |
33% |
About
19% (earlier cohort) |
Moderate
retention; about 27% of the 2019 cohort held work-related status after five
years |
|
Netherlands |
23% |
19% |
About
12% (earlier cohort) |
Higher
retention initially after graduation, declining over time |
|
United
Kingdom |
16%
(2015, earlier system) |
7% |
About
16% (2010 cohort) |
Marked
increase after the Graduate Route; 41% of the 2020 cohort still held status
after five years |
3 Permanent Status and the Limits of Post Graduation Work
Permits
|
Country
/ cohort |
Remaining
locally over the long term |
Permanent
status / citizenship |
Temporary
work status |
Notes |
|
Germany:
first student residence permits in 2006–12, after 10 years |
46% |
24.8%
of the original cohort had acquired permanent settlement permits or German
citizenship |
5.7% of
the original cohort held temporary employment residence permits |
Permanent
status had become more prevalent than temporary employment residence alone |
|
United
Kingdom: 2020 Sponsored Study cohort, after 5 years |
41% |
Less
than 1% had ILR |
26% on
work routes |
The new
Graduate Route raises short- and medium-term retention, but five-year
permanent-status acquisition remains very low |
|
Canada:
historical study-permit cohorts, after 10 years |
— |
About
20–27% overall transitioned to PR; very large differences by origin |
Post-graduation
work permits also available |
PR
provides this report’s strongest case for economic differences by origin |
|
New
Zealand: earlier graduate cohorts |
About
51% still in New Zealand after 5 years |
An
average of 13% already held domestic status at graduation in 2010–14 |
Others
could continue working / studying |
About
49% were overseas after five years; this cannot all be interpreted as return
to origin |
4 Economic Development at Origin and Permanent Residence
in Canada
Statistics Canada not only compares countries of origin but
also places origin-country GDP per capita and the proportion of international
students transitioning to permanent residence within ten years in the same
regression framework. Its official conclusion is that international students
from countries with lower GDP per capita generally have higher
permanent-residence transition rates than students from countries with higher
GDP per capita.
Figure 2. Canada: economic development at origin and
ten-year permanent-residence transition rates in historical Statistics Canada
cohorts
|
Place
of origin |
Log
GDP per capita (original study) |
Canadian
PR within 10 years |
Sample
size |
|
Nepal |
5.6 |
35.9% |
529 |
|
Cambodia |
5.8 |
56.3% |
396 |
|
Vietnam |
6.1 |
54.6% |
3,845 |
|
India |
6.3 |
53.3% |
14,174 |
|
Pakistan |
6.3 |
45.1% |
4,428 |
|
Taiwan |
6.8 |
26.8% |
28,850 |
|
Sri
Lanka |
6.8 |
57.4% |
1,618 |
|
China |
7.1 |
50.2% |
67,823 |
|
Syria |
7.2 |
58.7% |
445 |
|
Thailand |
7.7 |
11.5% |
4,511 |
|
Malaysia |
8.3 |
15.4% |
6,504 |
|
Lebanon |
8.5 |
59.6% |
1,989 |
|
South
Korea |
9.6 |
13.8% |
101,607 |
|
Israel |
9.8 |
33.5% |
2,916 |
|
Singapore |
9.9 |
15.2% |
3,859 |
|
Hong
Kong |
9.9 |
28.2% |
29,802 |
|
UAE |
10.2 |
33.3% |
1,456 |
|
Japan |
10.4 |
6.5% |
73,506 |
|
Statistical
test |
Result |
|
Pearson
r |
?0.617
(p = 0.0064) |
|
Spearman
? |
?0.542
(p = 0.0203) |
|
Quadratic-fit
R² |
0.385 |
|
Direction |
Clear
negative correlation: lower economic development at origin was historically
associated with higher Canadian PR transition rates |
|
Caution |
An
association in historical cohorts does not represent an individual student’s
current causal probability; Canadian immigration policy has changed
repeatedly |
5 Differences by Place of Origin and Exceptions to the
Income Pattern
|
Country
/ region of origin |
Canadian
PR transition within 10 years |
Interpretation |
|
Sri
Lanka |
57.4% |
Lower-income
origin; high propensity to obtain PR |
|
Vietnam |
54.6% |
Lower-income
origin; high propensity to obtain PR |
|
India |
53.3% |
Lower
income and a large destination-country wage gap; high propensity to obtain PR |
|
China |
50.2% |
Lower
income at the time; large-scale transition to PR |
|
Pakistan |
45.1% |
Lower
income; a higher transition rate than high-income East Asian origins |
|
Nepal |
35.9% |
Lower
income but a smaller sample; shows that income is not the only variable |
|
Hong
Kong |
28.2% |
Higher
income; moderate transition rate |
|
Malaysia |
15.4% |
Middle
to high income; lower transition rate |
|
Singapore |
15.2% |
High
income; lower transition rate |
|
South
Korea |
13.8% |
High
income; low transition rate |
|
Thailand |
11.5% |
Income
is not exceptionally high, yet transition is low; an important counterexample |
|
Japan |
6.5% |
High
income and strong domestic opportunities; very low transition rate |
6 United States Doctoral Retention and the Returns to
Skills and Specialisation
Figure 3. United States: proportion of science and
engineering doctorate recipients remaining approximately five years after
graduation
The U.S. National Center for Science and Engineering
Statistics (NCSES) followed science and engineering doctorate recipients who
graduated in 2017–19 and held temporary visas at graduation. In 2023, 73%
overall still lived in the United States. The proportions were 86% for India,
83% for China, 68% for Taiwan, 53% for Turkey, and 50% for South Korea. These
data do not represent all international bachelor’s or master’s graduates in the
United States. Nevertheless, they clearly demonstrate the strong retention
effects of U.S. research salaries and career opportunities for highly skilled
STEM talent. Doctoral retention is high for both China and India despite their
different economic development levels.
7 Germany Retention and Naturalisation
Figure 4. Germany: proportion acquiring German citizenship
among former international students still in Germany after ten years, selected
origins
Detailed analysis by place of origin from the German Federal
Statistical Office (Destatis) shows that, among former international students
still in Germany after ten years, an average of 28% had acquired German
citizenship. Differences by origin are substantial: Cameroon 50%, Brazil 34%,
India 32%, Turkey 24%, Russia 12%, China 10%, and the United States 3%. These
findings again align with the general pattern that larger opportunity gaps at
origin tend to strengthen motivations to acquire permanent status. However,
nationality law, attitudes towards dual citizenship, family formation, and
cultural factors also significantly influence naturalisation decisions.
8 United Kingdom Short Term Retention and Permanent
Settlement
The United Kingdom provides a particularly clear
illustration of why a work visa does not equal permanent status. The 2020
Sponsored Study cohort comprised 179,161 people. Five years later, in 2025, 41%
still held valid or permanent status: 6% remained on study routes, 26% had
moved to work routes, and 9% were in other categories. Yet fewer than 1% had
obtained indefinite leave to remain (ILR). The Graduate Route can therefore
substantially increase retention over three to five years, but determining whether
this ultimately leads to long-term settlement requires follow-up over ten years
or longer.
9 New Zealand Evidence on Departure from the Destination
Country
Longitudinal data from New Zealand’s Ministry of Education
show that, in earlier cohorts, approximately 49% of all international graduates
were overseas five years after completing their qualifications, rising to
approximately 59% after eight years. Among young international graduates,
approximately 53% were overseas after five years. However, “overseas” still
does not strictly mean return to the country of origin: graduates may have
moved to Australia, the United Kingdom, the United States, or another third
country. Separately, a doctoral study published in 2025 shows that one-year
retention among international doctoral graduates increased from 34% for the
2005 graduating class to 59% for the 2023 class. Five-year retention for the
2019 class was approximately 42%.
10 Are Students from Poorer Countries Less Willing to
Return
The overall answer is that there is clear evidence
supporting this pattern, but it should not be presented as an absolute rule.
Canada currently provides the most direct evidence: official research
explicitly finds that international students from countries with lower GDP per
capita generally transition to permanent residence at higher rates. In the
Statistics Canada data for Asian places of origin selected for this report,
economic development is significantly negatively correlated with ten-year
permanent-residence transition. Historical cohorts from India, Vietnam, China,
and Sri Lanka had much higher transition rates than those from Japan, South
Korea, and Singapore.
However, “poverty” is only a proxy. What usually drives a
decision not to return is the difference in expected lifetime benefits between
destination and origin, including wages, career development, research
conditions, social stability, children’s education, immigration policy, and
family formation. A more scientifically grounded hypothesis is therefore: the
greater the gap in economic and career opportunities between the destination
country and the country of origin, the higher the probability of long-term
graduate retention and acquisition of permanent status, after controlling for
field of study, qualification level, age, language, family circumstances, and
immigration policy.
11 Recommended Econometric Models
|
Variable |
Expected
direction |
Reason |
|
Destination-to-origin
per capita income ratio |
+ |
A
larger opportunity gap increases the benefits of remaining |
|
Destination-to-origin
graduate wage ratio |
+ |
Directly
affects career returns |
|
Youth
unemployment rate at origin |
+ |
A
higher opportunity cost of returning |
|
Accessibility
of permanent-residence pathways at destination |
+ |
Institutions
directly affect retention |
|
STEM /
healthcare / shortage fields |
+ |
Greater
ease of finding employment and meeting immigration requirements |
|
Density
of high-paying jobs at origin |
? |
Makes
returning more attractive |
|
Political
/ social risks at origin |
+ |
Strengthens
motivations for long-term retention |
|
Family
/ spouse in the destination country |
+ |
Significantly
increases the probability of long-term settlement |
|
Geographical
and cultural distance |
Uncertain |
May
reduce willingness to stay, or reinforce the migration costs already incurred |
For a formal academic model, student-level data or a panel
organised by country of origin × destination country × graduation year is
recommended. Five-year retention, ten-year retention, permanent residence, and
naturalisation should be treated as separate dependent variables. Fixed-effects
models, multilevel logit models, or survival analysis should be used rather
than combining the four outcomes into a single indicator.
12 Data Limitations
No global database tracks all international graduates in the
same year and under the same definitions across all outcomes: remaining
locally, returning to origin, moving to a third country, obtaining permanent
residence, and naturalising. OECD data must therefore be combined with national
administrative data.
Canada’s regression linking origin-country GDP to
permanent-residence transition uses historical cohorts. It is well suited to
testing structural relationships but cannot be treated as an individual’s
immigration probability in 2026.
The most reliable U.S. long-term tracking by origin focuses
on science and engineering doctorate recipients, so its findings cannot be
generalised to all bachelor’s and master’s graduates.
German data have been revised following methodological
changes to the Central Register of Foreigners. The permanent-status section of
this report prioritises the updated Destatis 2023 measures.
The United Kingdom introduced the Graduate Route in 2021.
Earlier and more recent cohorts cannot be compared as if they faced the same
policy environment.
Leaving the destination country cannot automatically be
treated as returning to the country of origin. Migration to third countries is
an important component of international graduate mobility.
13 Main Conclusions
First, short-term retention after graduation and permanent
settlement are distinct outcomes. Five-year retention exceeds 60% in Canada and
Germany, while acquisition of permanent status requires a longer observation
period. The United Kingdom’s newer arrangements have increased short-term
retention on work routes, but acquisition of ILR within five years remains
below 1%. Second, economic development at origin has a substantive relationship
with permanent settlement. Historical official Canadian data provide the
strongest evidence: origins with lower GDP per capita generally have higher
permanent-residence transition rates. Third, this pattern is not determined by
a single variable. Very high retention among U.S. STEM doctorate recipients
demonstrates the strength of returns to specialisation and talent selection,
while German naturalisation data show that law, family circumstances, and
nationality preferences also matter. Fourth, for international education
recruitment and WSL AI, students’ study-abroad goals should be further divided
into three categories—Return-oriented, Work-oriented, and
Settlement-oriented—rather than asking only whether they wish to study abroad.
14 Key References
1. OECD (2022), International Migration Outlook 2022,
chapter on retention and economic impact of international students.
2. OECD (2026), International Students in Higher Education,
Post-graduation opportunities and possibilities.
3. Statistics Canada (2015), International students who
become permanent residents in Canada.
4. Statistics Canada (2021), International students as a
source of labour supply: Transition to permanent residency.
5. UK Home Office (2026), Migrant journey: 2025 report /
Immigration system statistics.
6. U.S. National Center for Science and Engineering
Statistics (2025/2026), stay rates of U.S.-trained S&E doctorate
recipients.
7. German Federal Statistical Office (Destatis),
international student retention and permanent residence/naturalisation
analyses.
8. New Zealand Ministry of Education, Moving places:
Destinations and earnings of international graduates; doctoral graduate
mobility report.
© 2026 World Schools League
© 2026, World Schools League


 WSL AI 360